Sunday, 23 March 2014


Saturday, 22 March 2014


Sunday, 16 March 2014


Sunday, 16 February 2014
Update statement in SQL
Update statement in SQL
Update statement in SQL is generally to update a value in a table. We should generally be very conscious while using this statement. If you do not specify where clause in update statement all the records in the specified column will be updated with the mentioned value and the entire column will contain only one value
Consider below table 'test'

If we use a Update statement as below without any where condition then all the values fname will be set to 'ABCD' i.e. all the four rows in the fname column will have 'ABCD' as value
update table test
set fname = 'ABCD'
Hence, it is always recommended that you specify a where condition which fulfill all the criteria, as below
update table test
set fname = 'ABCD' where lname = 'abc1'
Here, only the row which has 'abc1' as lname will be updated
We can also update multiple columns in a single update statement as below
Update table tablename
Set Column1= '', Column2='',......
how to add a column to an existing table in sql
Add a column in an already existing table in SQL
To add a column in an already existing table, you will need to alter the existing schema of that table. To achieve that we will have to use ALTER statement.
Consider a table named 'Test' which is as below:
Suppose we need to add another column called 'Ids' which is an identity column and give a unique number to each column, you can easily achieve this using the below query
alter table dbo.Input
add ids bigint identity(1,1)
Select INTO in SQL
Select INTO in SQL
Select into is used to make a new table which will contain the data that is the result set of the query in which it is used.
For Example:
Consider a name named 'Test' structure of which is as below
Now, we will try this with a simple query as below
Select * into test123 from test
a new table named 'test123' will be created in the same database in which the 'test' table exists. The test123 table will be exactly like the test table. so both table will have the same schema and same data in it.
Now, we will add condition to the above query as follows:
Select fname,lname into test123 from test where lname like 'abc'
In this case, a table will be created with name 'test123' which will have only two column fname and lname and also only two rows from the table test will be copied into test123 which satisfies the condition of lname like 'abc'
Select Into is generally used to make a backup of a particular data set.
Saturday, 15 February 2014
T- SQL Interview Questions and Answer
T- SQL Interview Questions and Answer
- Different type of statements in SQL?
- What's the use of INTO keyword in Select statement in SQL?
- How do you add a column in an already existing table in SQL?
- How to update a value in a column in SQL?
- Can you rename an object in SQL?
- What is identity in SQL and whats the use of it?
- How to reset an identity?
- Difference between having and where clause?
- What data types have you used to setup a table?
- Whats the different between nvarchar and varchar?
- Difference between delete and truncate command ?
- Difference between truncate and drop command?
- What are joins in sql and explain different types of Joins?
- Difference between Union and Union All?
- What are Indexes?
- Different Types of indexes?
- Difference between clustered and non - clustered indexes?
- What are Views in SQL?
- What is CTE in SQL?
- Difference between CTE and Views?
- What is temp table?
- What is temporary variable?
- Difference between temp table and temp variable?
- Difference between temp table and CTE?
- What is Sub-Query in SQL?
- What is Nested query in SQL?
- What is inline Query in SQL?
- What are ranking functions in SQL?
- Difference between Rank and Dense Rank?
- Which Ranking functions is used to delete duplicate rows from a table?
- what is store procedure?
- what is UDF in SQL?
- difference between a store procedure and function in SQL?
- whats the use of NO COUNT?
- What is charindex function used for in SQL?
- What is substring function used for in SQL?
- What is coalesce function in SQL?
- difference between coalesce and ISNULL function?
- what is datediff function?
- what is dateadd function?
- explain functionality of Case function?
- how to use Case function in Select statement?
- Write a query to generate Running Total?
- Write a query to generate Running Average Values?
- What is BCP in SQL?
Sunday, 9 February 2014
Stack Chart in SSRS
Stack Chart in SSRS 2008
For stack chart we will try to show Expense, online profit and offline profit according to locales in SSRS
- Drag n Drop charts from the toolbox to the report
- select stack chart from the options

- In values section, select expenses, online revenue and offline revenue and select locale in category

- Right click on vertical axis and select vertical axis property
- Select "Use logarithmic Scale" and click on OK. You will observe that know the vertical axis is calculated logarithmic-ally

- Click on preview window and preview the chart

3D Pie chart in SSRS
3D Pie chart in SSRS
Here we will show Page Views according to Locales in Pie Chart
The locale column contains the locale names and page views column contains the respective number of page views
- Add a report and map the data set with report
- From the toolbox drag n drop chart to the reports

- Select Exploded Pie chart

- Enter Page Views in Values Section and locale in series section

- Right Click and select show data labels
- Select data labels and from the properties window set position property to Outside, so that the labels are displayed outside the pie chart
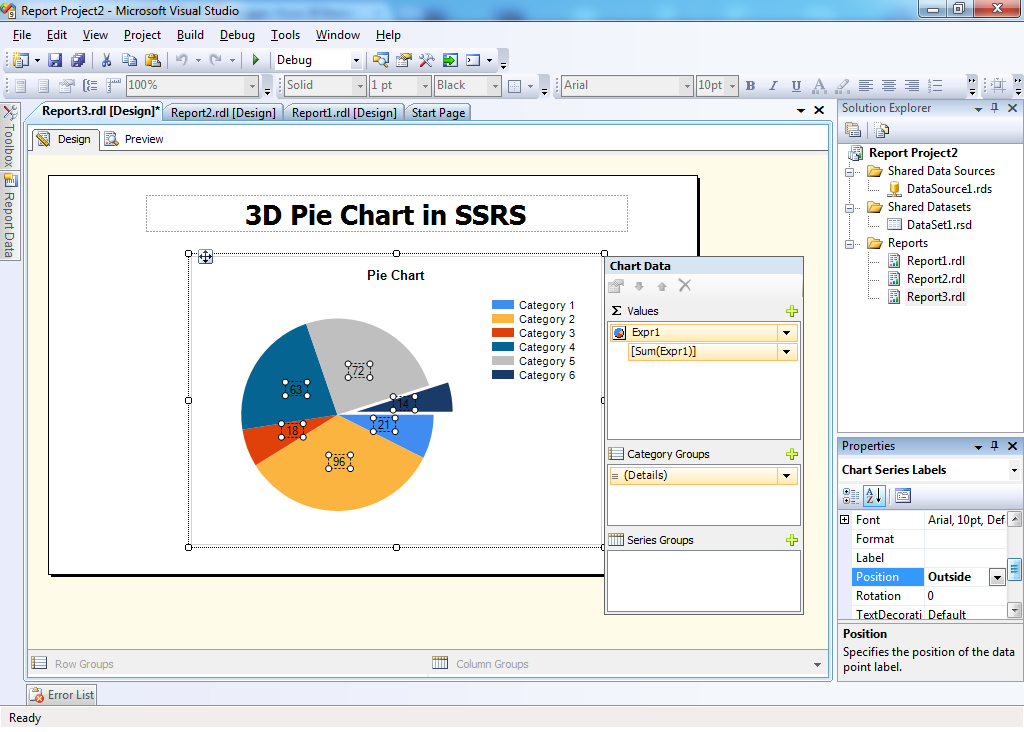
- Right click and select chart properties
- In the chart properties, select 3D display option and check the Enable 3D option

- Click on preview window and view the chart

Saturday, 8 February 2014

Saturday, 1 February 2014
Pie Chart in Tableau
Pie Chart in Tableau
Arrange your data as below:

Open tableau workbook and connect to the data source
Drag and Drop date column into the Rows section

Drag and Drop Sections to Color field
 Drag and Drop Count to Size fields and your Pie cart will be ready
 Download the sample Pie chart Tableau workbook from below

Arrange your data as below:
Open tableau workbook and connect to the data source
Drag and Drop date column into the Rows section
Drag and Drop Sections to Color field
Sunday, 26 January 2014


Connect SSRS with Excel Step by Step
Connect Excel as source to SSRS
Click on create 'Add new data scource'

Choose ODBC as Connection Type and click OK

Choose Excel System Data source name

Select 'Use Connection String'

Select Excel as 'Machine Data Source' and click on New

Select User Data Source and Click on Next

Select 'Microsoft Excel Driver' and click on Next

Click On Finish

Give Data Source as Name

Select the Excel file and Click on OK

Click on create 'Add new data scource'
Choose ODBC as Connection Type and click OK
Choose Excel System Data source name
Select 'Use Connection String'
Select Excel as 'Machine Data Source' and click on New
Select User Data Source and Click on Next
Select 'Microsoft Excel Driver' and click on Next
Click On Finish
Give Data Source as Name
Select the Excel file and Click on OK


Saturday, 7 December 2013
Creating simple Bar chart in Tableau
Creating simple Bar chart in Tableau
This is my first post on Tableau. Tableau is a fantastic data visualization tool. It help us to create some fantastic dashboards using this tool.
In this post we will learn how to create a simple bar chart in the dashboard.

As shown in the above screen shot, my data contains list of countries the regions and sub-region in which they falls.
We will now create a bar chart which will display the no. of countries according to the regions.
Step1: Drag and drop Region field in the dimension section to columns and Number of countries field in the row section.

A graph will be plotted automatically as shown in the above figure.
Step2: To add label to the graph, drag and drop the 'number of countries' field in the label section.

Now the labels is visible on the graph
Step3: Now we will color the graph according to the 'Number of countries'. The darker the color the larger the number of countries available in the region.

Step4: Sort the graph according to the number of countries. Go to column field and click on the 'Region' field and select the option sort -> ascending-> sort by field-> click OK.

You can also sort the chart in descending order by selecting the descending option.
This is my first post on Tableau. Tableau is a fantastic data visualization tool. It help us to create some fantastic dashboards using this tool.
In this post we will learn how to create a simple bar chart in the dashboard.

As shown in the above screen shot, my data contains list of countries the regions and sub-region in which they falls.
We will now create a bar chart which will display the no. of countries according to the regions.
Step1: Drag and drop Region field in the dimension section to columns and Number of countries field in the row section.

A graph will be plotted automatically as shown in the above figure.
Step2: To add label to the graph, drag and drop the 'number of countries' field in the label section.

Now the labels is visible on the graph
Step3: Now we will color the graph according to the 'Number of countries'. The darker the color the larger the number of countries available in the region.

Step4: Sort the graph according to the number of countries. Go to column field and click on the 'Region' field and select the option sort -> ascending-> sort by field-> click OK.

You can also sort the chart in descending order by selecting the descending option.
Subscribe to:
Posts (Atom)