3D Pie chart in SSRS
Here we will show Page Views according to Locales in Pie Chart
The locale column contains the locale names and page views column contains the respective number of page views
- Add a report and map the data set with report
- From the toolbox drag n drop chart to the reports

- Select Exploded Pie chart

- Enter Page Views in Values Section and locale in series section

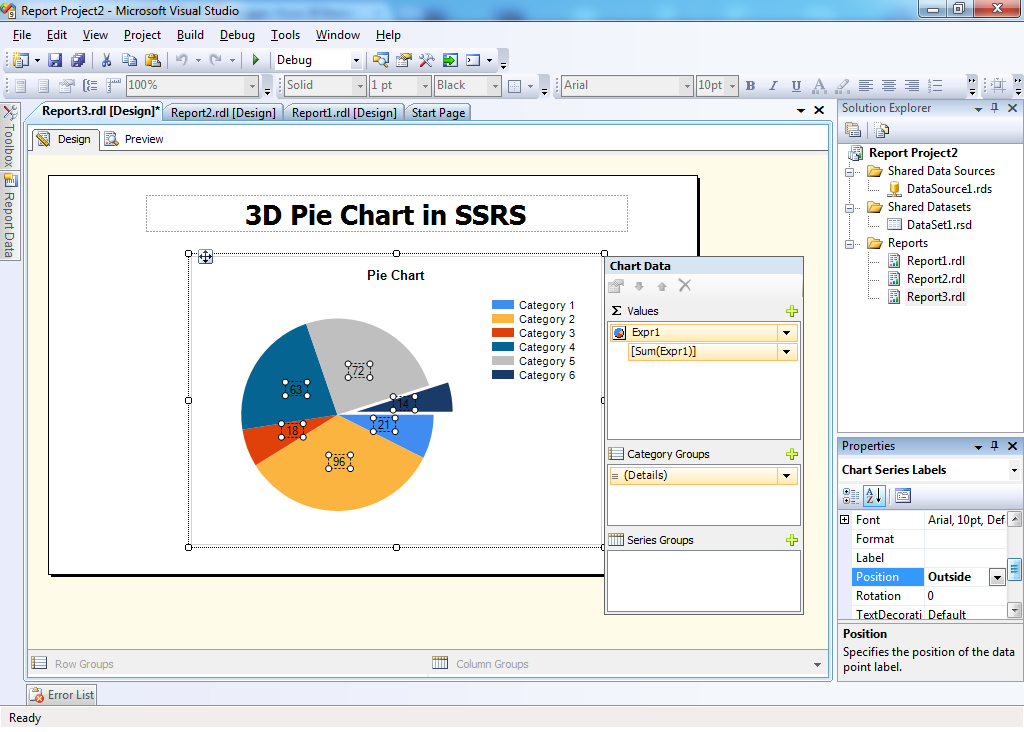
- Right Click and select show data labels
- Select data labels and from the properties window set position property to Outside, so that the labels are displayed outside the pie chart
- Right click and select chart properties
- In the chart properties, select 3D display option and check the Enable 3D option

- Click on preview window and view the chart

No comments:
Post a Comment